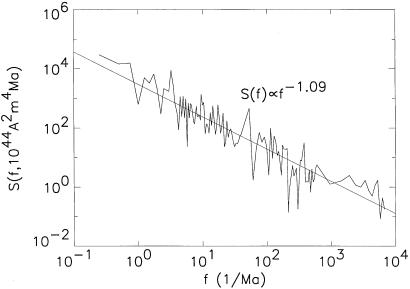
Fig 8.
Power spectrum of the geomagnetic field intensity variations estimated with the use of the Lomb periodogram from sediment cores of Meynadier et al. (22, 23) and archeomagnetic data from Kovacheva (21). The power spectrum S is given as a function of frequency f for time scales of 100 years BP to 4 Ma.

