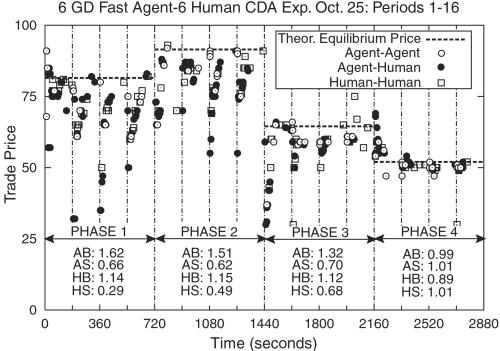
Fig. 1.

Trade price vs. time for experiment of October 25 with six GD fast agents and six humans. The vertical dashed lines indicate the start of a new trading period. The 16 trading periods were divided into four phases, each with its own set of limit prices. In each phase, p* is shown by the horizontal dashed lines. Trades between two agents are shown with open circles, between two humans with open squares, and between an agent and a human with solid circles. The labels AB, AS, HB, and HS refer to the average efficiency of Agent Buyers, Agent Sellers, Human Buyers, and Human Sellers, respectively. The overall market efficiency was 0.946:1.052 for the agents and 0.840 for the humans.
