
Fig. 2.
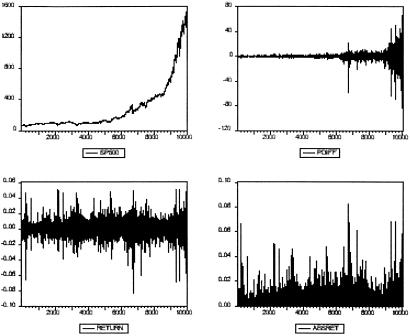
Time series for daily S&P 500 data, 08/17/1961–05/10/2000, namely the index (Top Left), changes of the index (Top Right), returns (i.e., relative changes, Bottom Left), and absolute returns (Bottom Right).
Official websites use .gov
A
.gov website belongs to an official
government organization in the United States.
Secure .gov websites use HTTPS
A lock (
) or https:// means you've safely
connected to the .gov website. Share sensitive
information only on official, secure websites.
Time series for daily S&P 500 data, 08/17/1961–05/10/2000, namely the index (Top Left), changes of the index (Top Right), returns (i.e., relative changes, Bottom Left), and absolute returns (Bottom Right).