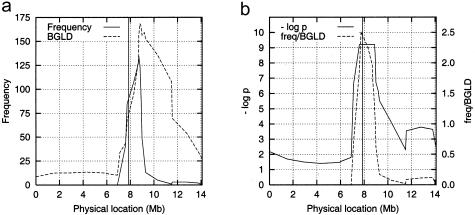
Figure 5.
Results on the real HLA data. a, Marker frequencies and background LD (BGLD), as measured by the markerwise mean of the 10 highest frequencies obtained by 10,000 permutations. b, Negative logarithm of the markerwise P values. The vertical line shows the gene location. The flat interval of −log p≈9.21 is the upper limit of the score, due to the limited number of permutations. The ratio of the marker frequency to BGLD (dashed curve) was used for estimating the gene location inside this interval.

