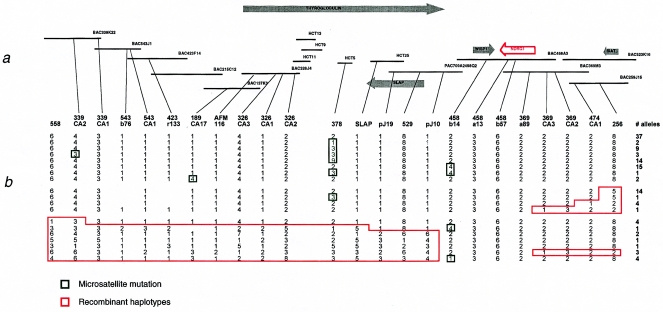
Figure 1.
a, Diagram of the BAC, PAC, and cosmid (HCT) clone contig of the HMSNL region. Known genes are represented by arrows pointing in the direction of their transcription. b, Positions of polymorphic microsatellites used to construct haplotypes on disease chromosomes. The HMSNL critical interval is flanked by markers pJ10 and 369CA3 and contains the WISP1 and NDRG1 genes.

