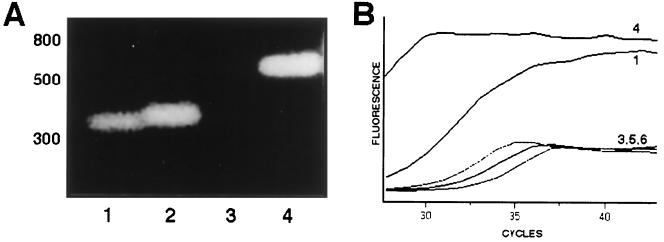
FIG. 3.
Analysis of porin gene expression from isolate 103624 by RT-PCR and agarose electrophoresis of the amplicons (A) or by real-time RT-PCR (B). In panel A, ompK36 amplicons are shown in lanes 1 and 2 and ompK35 amplicons are shown in lanes 3 and 4. Odd lanes show amplicons from RNA, and even lanes show amplicons from DNA. The numbers in panel B correspond to the lane numbers in panel A, except that lane 2 was not included and additional lanes 5 and 6 correspond to negative controls (water instead of RNA or DNA).

