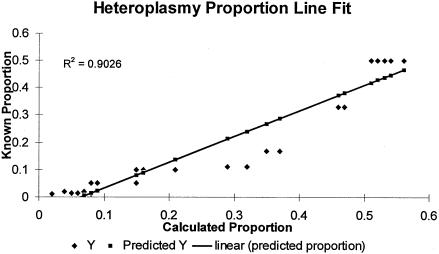
Figure 2.
Least-squares line fit for known and calculated heteroplasmic proportions. A series of simulated heteroplasmic samples with various proportions of the minor species were analyzed by DGGE. The known heteroplasmic proportions were plotted against the calculated proportions after densitometric analysis of DGGE gel photographs (coefficient of correlation .9026).

