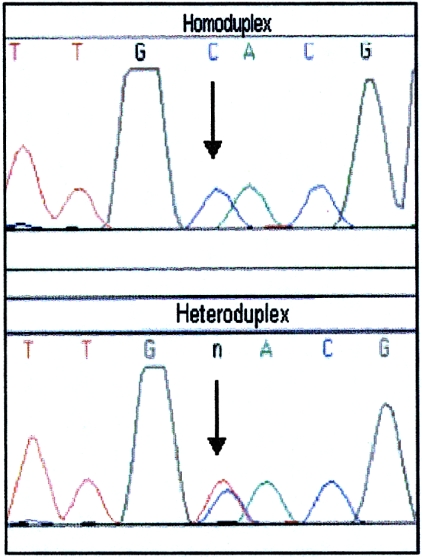
Figure 4.
Homoduplex and heteroduplex DNA sequences. Sequence electropherograms of reamplified homoduplex (top) and heteroduplex (bottom) DNA from a simulated heteroplasmic sample (prepared by combining two homoplasmic samples differing at a single position) are shown. Comparison of the sequence data allows for identification of the heteroplasmic position.

