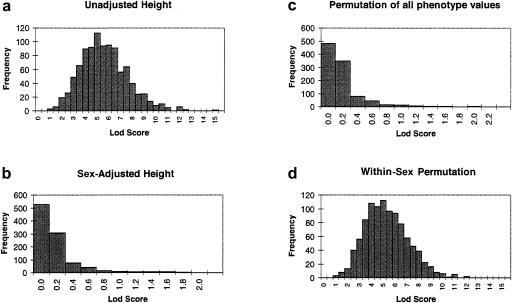
Figure 3.
Results from 1,000 replicates of a simulated marker on the pseudoautosomal regions unlinked to the quantitative trait “height,” for unadjusted analysis (a), analysis of sex-adjusted phenotypes (b), and for each of 1,000 permutations of the phenotypes, irrespective of sex (c). As can be seen, this estimated null distribution is incorrect, since panel a represents the true null distribution. Results obtained from permutation of the phenotypes within sex (d) give a more appropriate null-distribution reference, which is very similar to the null distribution in panel a.

