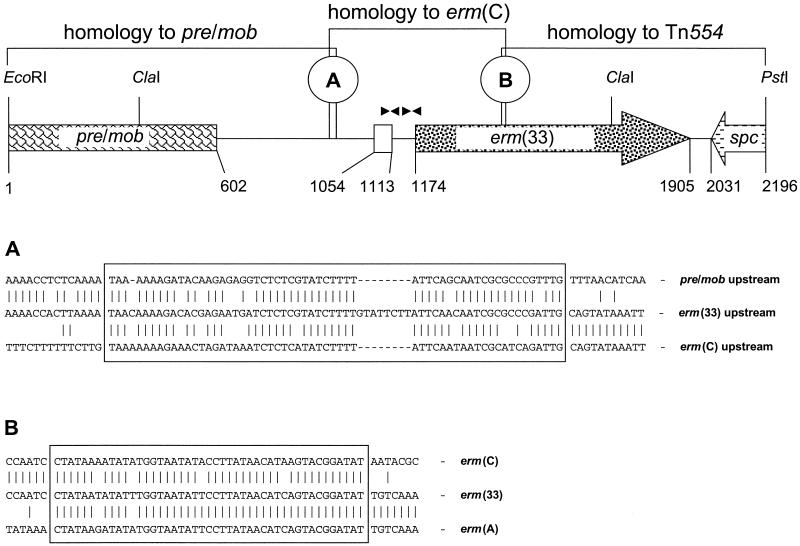
FIG. 1.
Restriction map and structural organization of the 2.2-kb EcoRI-PstI fragment of plasmid pSCFS1. The 5′ end of a pre-mob-like gene is shown as a box. The white box indicates the small reading frame for the 19-aa regulatory peptide. The black triangles represent the two pairs of inverted repeated sequences detected in the erm(33) translational attenuator. The erm(33) gene and the 3′ end of the spc reading frame are displayed as arrows, with the arrowhead showing the direction of transcription. The sequences of two potential recombination sites A and B (displayed as boxes) and their adjacent sequences are shown in detail below the map.

