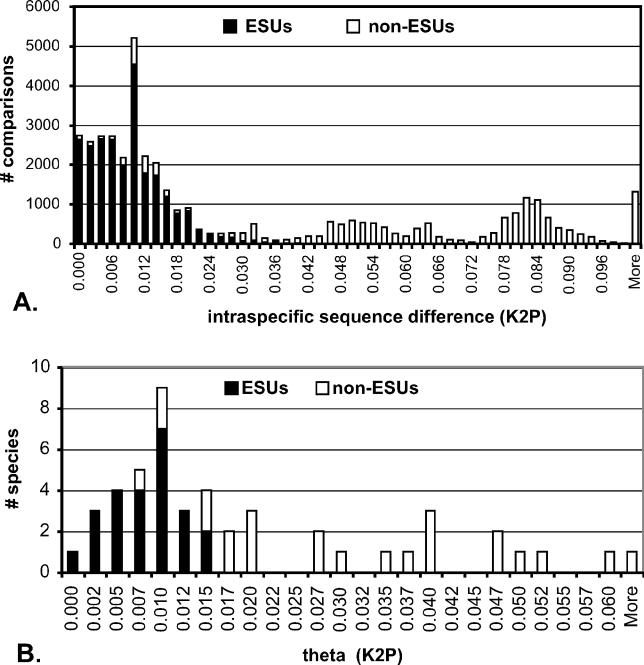
Figure 8. Intraspecific Variation Based on Recognized Species.
(A) The distribution of all intraspecific pairwise distances for traditionally recognized cowrie species with n ≥ 10. The white bars represent intraspecific distances where the two specimens compared fall into separate ESUs.
(B) Theta values for traditionally recognized cowrie species. Black bars are species that correspond to an ESU; white bars are species that include multiple ESUs.

