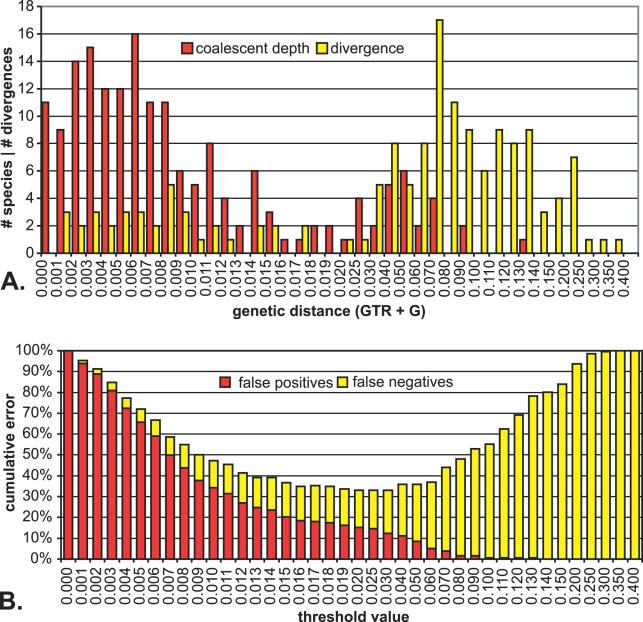
Figure 9. Barcoding Overlap: Cowrie Species.
Data are presented as in Figure 7; however, estimates of intraspecific variation and interspecific divergence are based on traditionally recognized cowrie species.
(A) Relative distributions of intraspecific variability (coalescent depth—red) and interspecific divergence between species (yellow), demonstrating a more pronounced overlap than when utilizing ESUs. Note that the x-axis scale shifts to progressively greater increments above 0.02.
(B) Cumulative error based on false positives plus false negatives for each threshold value. The optimum threshold value is 0.025 (5%), where error is minimized at 33%.

