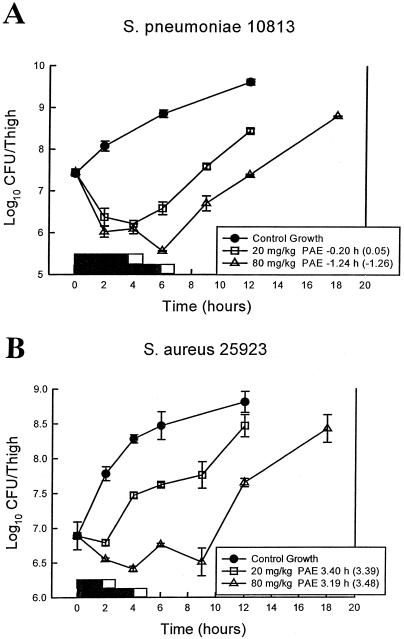
FIG. 2.
(A) In vivo PAE of linezolid after administration of single doses of 20 and 80 mg/kg against S. pneumoniae ATCC 10813. Symbols: □, data obtained with the 20-mg/kg dose; ▵, data obtained with the 80-mg/kg dose. Each symbol represents the mean ± the standard deviation for two mice. The solid bars represent the time that free-drug levels remained above the MIC. The open bars represent the time that total drug levels remained above the MIC. (B) In vivo PAE of linezolid after administration of single doses of 20 and 80 mg/kg against S. aureus ATCC 6538p. Symbols: □, data obtained with the 20-mg/kg dose; ▵, data obtained with the 80-mg/kg dose. Each symbol represents the mean ± the standard deviation for two mice. The solid bars represent the time that free-drug levels remained above the MIC. The open bars represent the time that total drug levels remained above the MIC.

