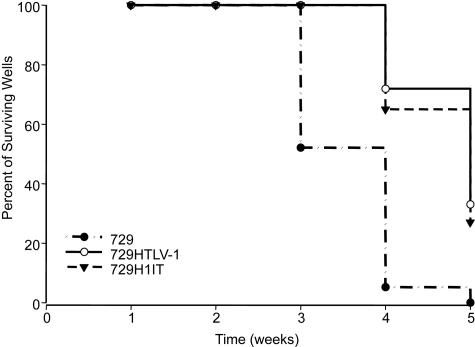
FIG. 5.
Representative Kaplan-Meier plot for T-lymphocyte proliferation in short-term microtiter assay. Prestimulated PBMCs (104) were cocultured with 200 irradiated 729 stable producer cells in 96-well plates. The percentages of proliferating wells were plotted as a function of time (weeks). Kaplan-Meier plots for wt HTLV-1 and H1IT and uninfected 729 control cells are shown. Results indicated that the percentage of wells containing proliferating lymphocytes was not significantly different between wt HTLV-1 and H1IT.

