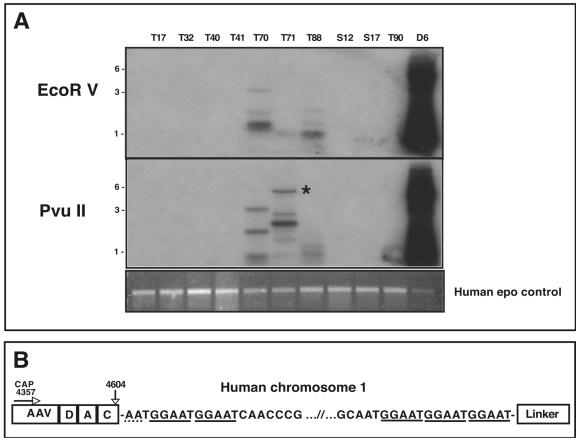
FIG. 4.
LAM-PCR of positive human clinical samples. (A) Southern blot of LAM-PCR using AAV-cap primers. LAM-PCR was performed using 1 μg of total cellular DNA with either AAV rep or cap primer (cap is shown). The top panel shows LAM-PCR using EcoRV as the blunt-cutting restriction enzyme, while the middle panel shows LAM-PCR using PvuII. The DNA was hybridized with an AAV-specific probe. Detroit 6 DNA (D6) was used as a positive control and gave the predicted size based on the restriction analysis of the AAVS1 locus (see Fig. 1A). Positive hybridization of various sizes can clearly be seen in samples T70, T71, and T88. Analysis of the LAM-PCR products revealed that an approximate 5.5-kb band in sample T71 contained an AAV-cellular junction (starred). The bottom panel shows an ethidium bromide stained gel of the LAM-PCR products using a human epo gene-specific primer as an internal control. All sample amplified the expected 500-bp genomic fragment, confirming the DNA integrity of the samples and the reproducibility of the LAM-PCR assay. (B) Schematic of AAV-cellular junction from tissue T71. The 3′ AAV sequence is represented on the left ranging from bp 4357 (the position of the cap LAM primer) to the junction at bp 4604 in the AAV ITR. The AAV sequence in the LAM-PCR product contained the 3′ cap sequence as well as a complete D, A, and C ITR region. There appears to be only 2 bp of homology between the breakpoint of the AAV ITR and the chromosomal sequence (dotted underline). The LAM-PCR product contained approximately 5 kb of human chromosomal DNA that mapped to position 1q31.1, composed primarily of a (GGAAT)n repeat sequence (solid underline).

