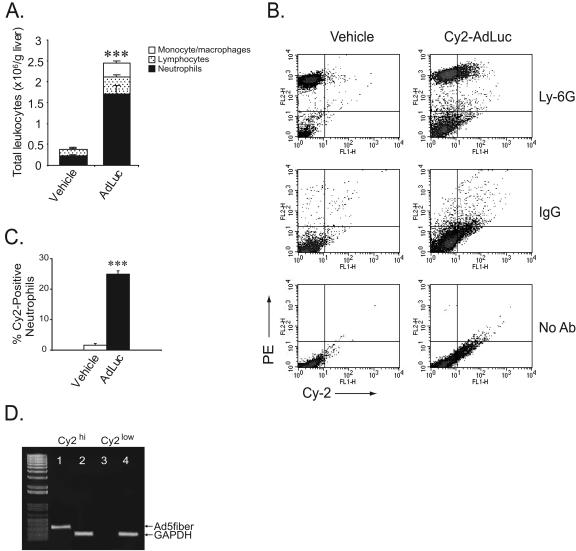
FIG. 1.
Neutrophil-adenovirus interaction in vivo. (A) Total liver leukocytes at 3 h following systemic administration of AdLuc or vehicle control. Each bar is subdivided to show the differential recruitment of leukocyte subsets. For neutrophils with AdLuc versus vehicle control, P < 0.005 (***); n = 6 to 14. Error bars indicate standard deviations. (B) Flow cytometry analysis of liver leukocytes from mice 3 h following intravenous administration of Cy2-AdLuc or vehicle control. Leukocytes were analyzed alone (lower panels) or stained with PE-conjugated isotype control rat IgG2a (middle panels) or anti-Ly-6G antibody (upper panels). The fluorescence histogram shows a subpopulation of Cy2-high, Ly-6G-positive liver leukocytes in Cy2-AdLuc-treated mice. (C) Percentage of Cy2-high cells within the Ly-6G-positive neutrophil population. For AdLuc versus vehicle control, P < 0.005 (***); n = 6. (D) PCR analysis of viral DNA in Cy2-high and Cy-2-low liver leukocyte fractions. Lane 1, Cy2-high, Ad5 fiber. Lane 2, Cy2-high, GAPDH. Lane 3, Cy2-low, Ad5 fiber. Lane 4, Cy2-low, GAPDH.

