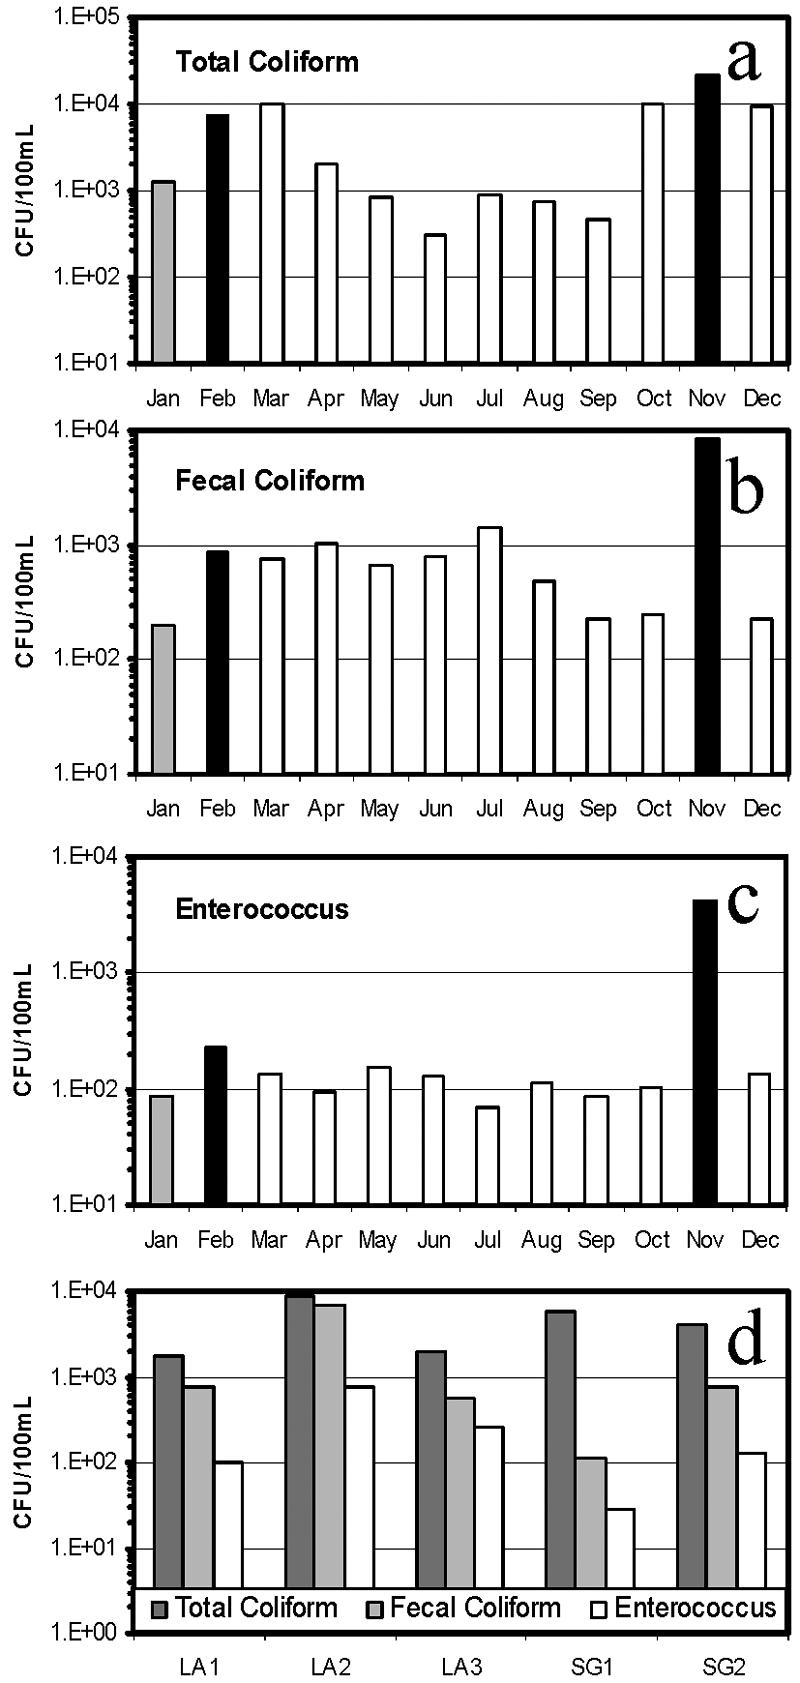
FIG. 2.

Monthly geometric mean distribution of total coliforms (a), fecal coliforms (b), and enterococci (c) at all sampling sites, and their annual geometric mean distribution at each sampling site (d). Dark bars indicate storm events within 48 h of sample collection, light gray bars indicate light rain (<0.05 in.), and open bars indicate no precipitation within 72 h of sample collection.
