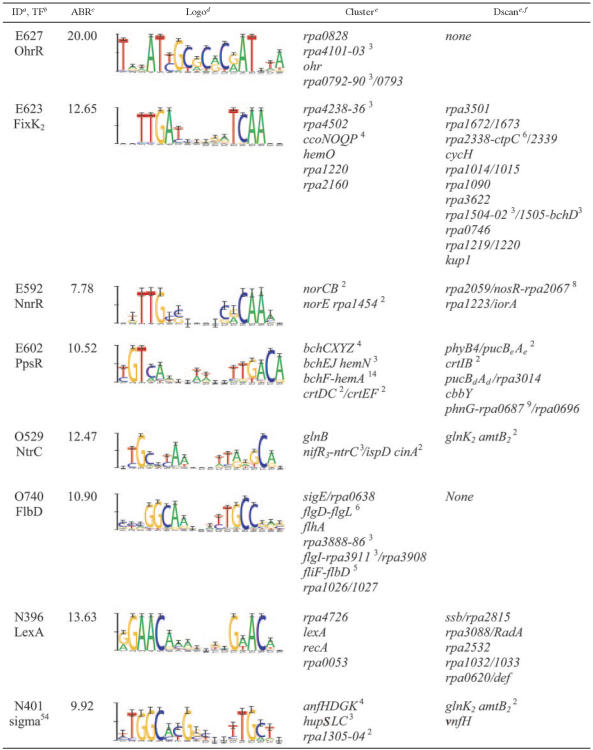
TABLE 2.
Selected clusters of phylogenetically footprinted motifs
ID, cluster identifier.
Predicted TF.
ABR, average Bayes ratio.
Cluster logo.
Divergently transcribed genes and operons are separated by a slash. Operons are shown as follows. A dash indicates an inclusive range of gene names. Large operons are denoted as a range between the first and last genes. A superscript indicates the number of genes in each operon.
Additional members of the regulon found by Dscan.

