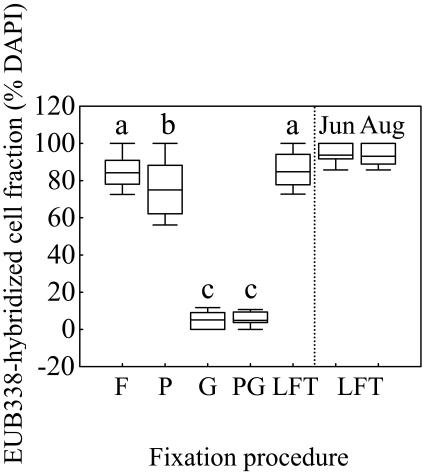
FIG. 2.
Detection of Bacteria (probe EUB338) by CARD-FISH at different fixation procedures. The boxes represent the median and the 25 and 75% percentiles. The bars indicate the 10 and 90% percentiles. The vertical dashed line segregates values for Fuirosos pond (left) from Lake Redon (right, June and August samples). Different letters above each box indicate treatments that differed significantly (P < 0.05, n = 50). See the text for abbreviations.

