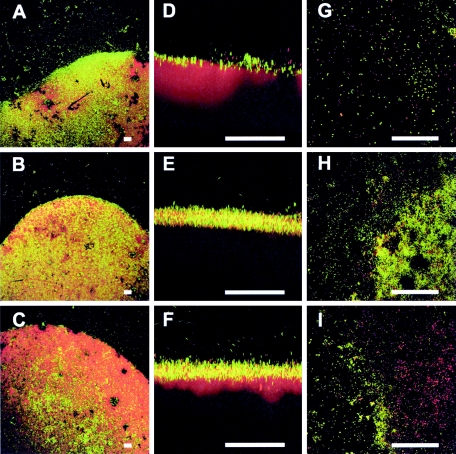
FIG. 3.
Biofilm development after 7 days (A, D, and G), after 10 days (B, E, and H), and after 31 days (C, F, and I). The PCB biofilm stained with SYBR green (bacteria) and Nile Red (PCB droplet) is shown as XY maximum-intensity projections (A, B, and C) and as XZ projections (D, E, and F). The PCB biofilm after staining with LIVE (green)/DEAD (red) is presented as maximum-intensity projections (G, H, and I).

