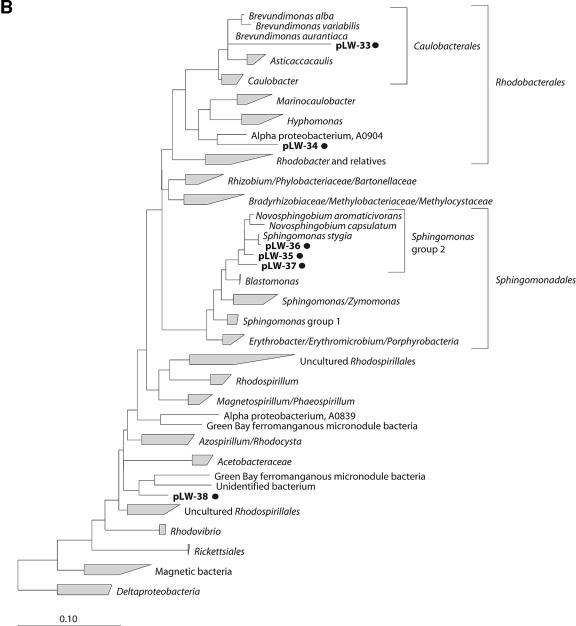
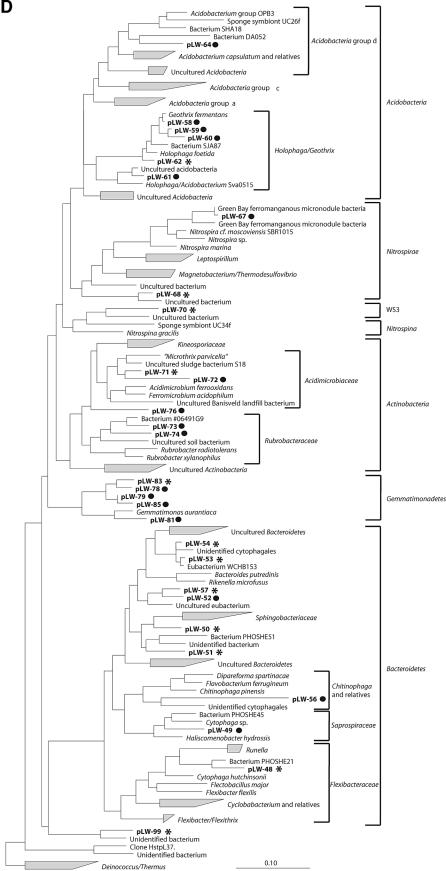
FIG.1.
Phylogenetic trees obtained by maximum-likelihood analysis, reflecting the relationships of 16S rRNA gene sequences amplified from RNA isolated from Lake Washington sediment (*) and from [13C]DNA fractions (•). Sequences determined in this study are in boldface. The scale bars indicate the number of expected nucleic acid substitutions per site per unit of branch length. (A) Beta- and Gammaproteobacteria phylogenetic tree. Alphaproteobacteria were used to root the tree; 1,389 characters were used to infer the tree. Partial sequences (<600 bp) were added to the tree by using a maximum-parsimony option within ARB; 433 characters were used. (B) Alphaproteobacteria phylogenetic tree. Deltaproteobacteria were used to root the tree; 1,365 characters were used to infer the tree. (C) Deltaproteobacteria phylogenetic tree; 1,392 characters were used to infer the tree. (D) Acidobacteria, Nitrospirae, Nitrospina, Actinobacteria, Gemmatimonadetes, and Bacteroidetes phylogenetic tree. Deionoccus and Thermus were used to root the tree; 1,287 characters were used to infer the tree. (E) Verrumicrobium, Planctomycetes, Chlorobi, Spirochaetes, and Chloroflexi phylogenetic tree. Deionoccus and Thermus were used to root the tree; 1,285 characters were used to infer the tree.


