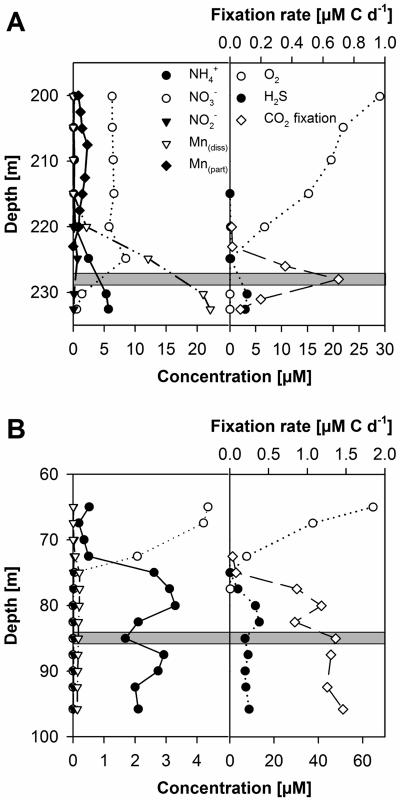
FIG. 2.
Depth profiles of NH4+, NO3−, NO2−, and particulate and dissolved Mn (left), as well as O2, H2S, and 14CO2 fixation (right), throughout the oxic-anoxic interface of Gotland Deep station 271 (A) and Landsort Deep station 284 (B) in August 2004. The shaded area indicates the CO2 fixation zone which was sampled for subsequent stimulation experiments.

