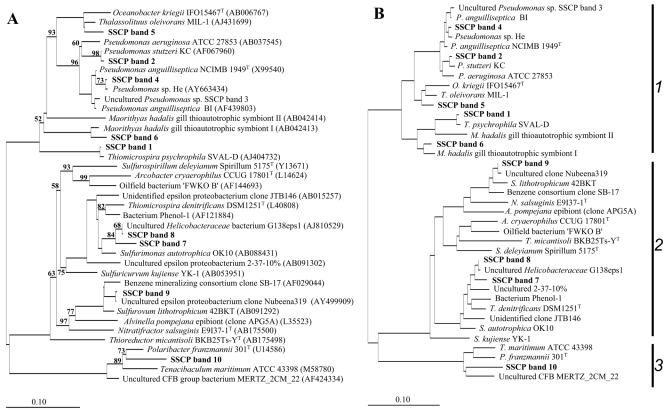
FIG. 4.
Unrooted trees showing phylogenetic relationships of the stimulated bacteria and their closest phylogenetic relatives. (A) Tree reconstructed using the neighbor-joining method and based on a comparison of approximately 300 nucleotides. Bootstrap values, expressed as a percentage of 1,000 replications, are given at branching points. Only those above 50% are shown. Database accession numbers are given in parentheses. (B) Basic tree reconstructed using the maximum-likelihood method and based on a comparison of approximately 1,400 nucleotides. Eventually, partial SSCP sequences were individually imported using ARB Parsimony. For both tree reconstruction methods, 42 members of the Verrucomicrobiaceae were used as an outgroup. Bar, 10 substitutions per 100 nucleotides. 1, Gammaproteobacteria; 2, Epsilonproteobacteria; 3, Bacteroidetes. More detailed information about the investigated sequences is given in Table 3.

