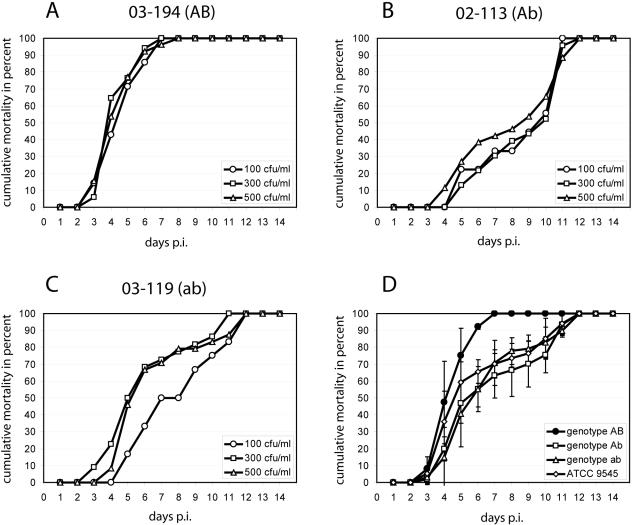
FIG. 2.
Time course of infection. (A to C) Cumulative mortality was calculated per day postinfection (p.i.) as described in the text and expressed as percentage of the infected hosts (i.e., all larvae that died from AFB in this replicate). Concentrations tested are given in each panel. Results from three representative experiments are shown for each strain. (D) Cumulative mortality was calculated for each genotype from all strains as described in the text, using the concentration closest to the estimated LC50. Therefrom, the mean cumulative proportion of AFB-dead larvae per day p.i. ±standard deviation was calculated for each genotype.

