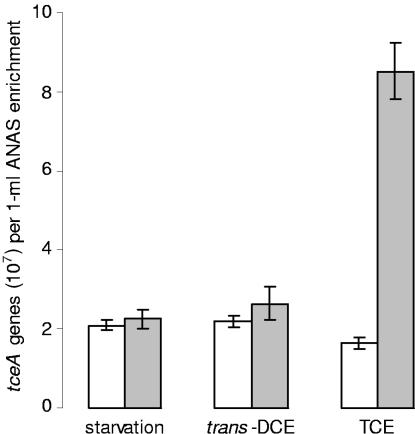
FIG. 2.
Quantity of tceA genes before and after chlorinated ethene starvation, incubation with trans-DCE, or incubation with TCE. Open bars are the initial quantities of tceA genes, and filled bars are the quantities of tceA genes after 10 days of incubation. All measurements are averages of triplicate qPCRs from duplicate biotic experiments, and error bars represent 1 standard deviation.

