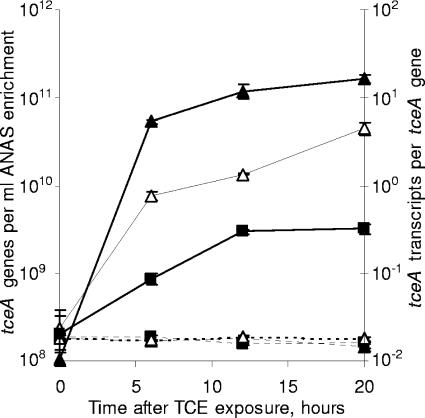
FIG. 5.
The effect of incubation temperature on the quantity of tceA genes (dashed lines, left y axis) and tceA transcripts per tceA gene (solid lines, right y axis). Parallel ANAS subcultures were amended with TCE and incubated at 30°C (▴), 22°C (▵), or 14°C (▪). All tceA measurements are averages of triplicate qPCRs or triplicate RT-qPCRs, and error bars represent 1 standard deviation.

