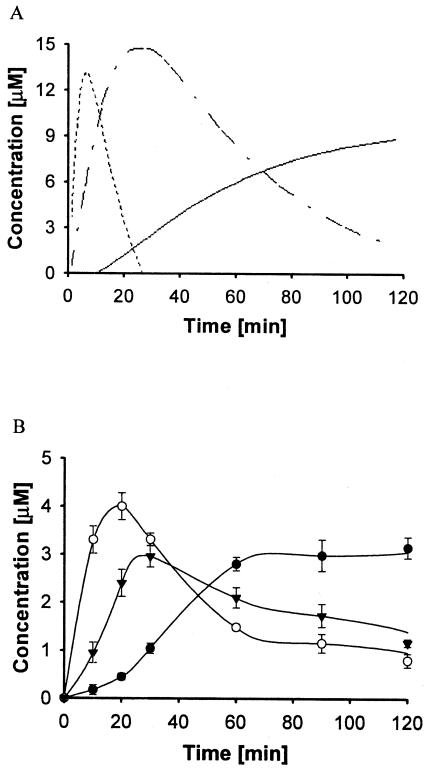
FIG. 3.
Time course of GPP, FPP, and DAP synthesis under the conditions described in Materials and Methods. (A) Predictions of kinetic modeling from equations 1 through 5. The dash, dash-dot, and solid lines represent GPP, FPP, and DAP, respectively. (B) Experimental time course using 40 μM IPP and 20 μM DMAPP. Symbols: ○, GPP (C10); ▾, FPP (C15); and •, DAP (C30).

