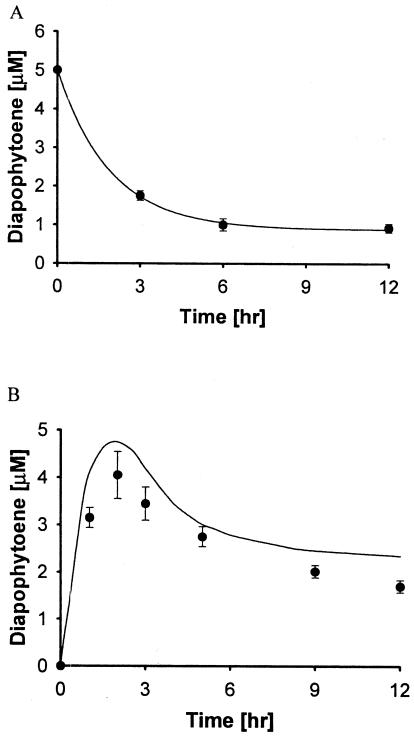
FIG. 4.
Time course of DAP (5 μM) degradation in aqueous buffer in the presence of DAP synthase at 37°C (A) and kinetic modeling (B) taking into account the rate of degradation of DAP (equation 7). For comparison of modeling results, 20 μM FPP was used as the substrate for experimental data. The symbols indicate the experimental data (•) and modeling equations (—) for equation 6 (A) and equation 7 (B).

