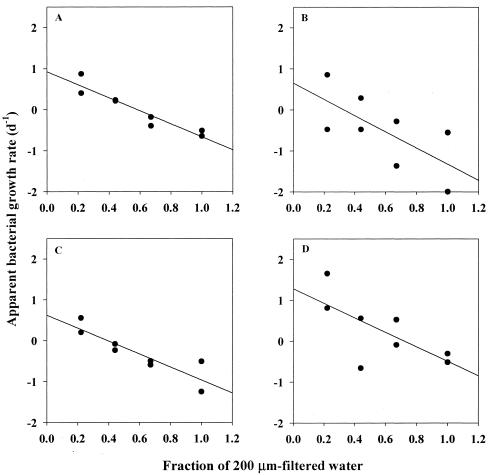
FIG. 3.
Relationships between apparent growth rates of bacterial groups (A, total bacteria detected by DAPI; B, α-proteobacteria; C, γ-proteobacteria; D, Cytophaga-Flavobacter cluster) and the degree of dilution of 200-μm-filtered seawater with 0.2-μm-filtered seawater (the data obtained in experiment 1 are shown as an example). Solid lines are linear fits of the data points. Statistical parameters for each regression are tabulated in Table 3.

