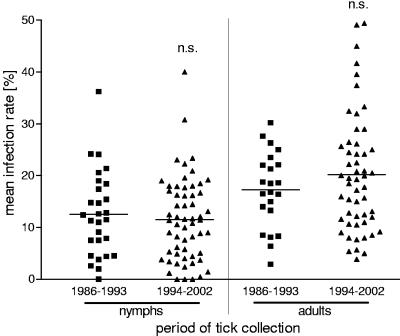
FIG. 5.
Comparison of rates of infection of nymphs and adults in two collecting periods. Each data point represents one record. To obtain a similar proportion of areas with high and low infection rates in both periods, data for extremely high infection rates (>30%) were excluded. n.s., not significant.

