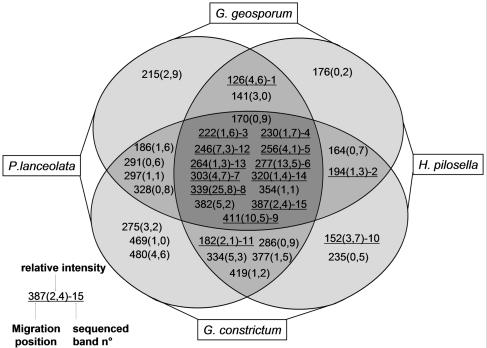
FIG. 3.
Distribution of the bands composing the DGGE profiles among the different culture conditions. The bands are named after their vertical position along the DGGE gel. The relative intensity as a mean value of the intensities of the bands obtained for the corresponding culture conditions is indicated in parentheses. Bands excised, cloned, and sequenced are underlined, and their assigned number is given.

