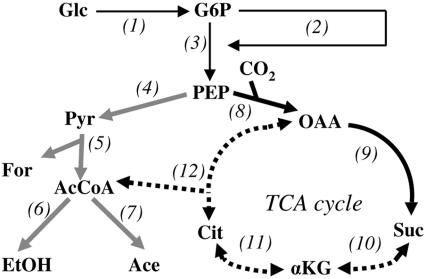
FIG. 1.
Simplified metabolic map of the central metabolism of A. succinogenes. Thin black arrows represent glucose uptake, pentose phosphate pathway, and Embden-Meyerhoff-Parnas pathway reactions. Gray arrows represent C3 pathway reactions. Thick black arrows represent C4 pathway reactions. Dashed arrows represent TCA-associated reactions that have not been tested. 1, hexokinase or PEP:glucose phosphotransferase; 2, pentose phosphate pathway; 3, Embden-Meyerhoff-Parnas pathway; 4, pyruvate kinase and PEP:glucose phosphotransferase; 5, pyruvate-formate lyase; 6, acetaldehyde dehydrogenase and alcohol dehydrogenase; 7, phosphotransacetylase and acetate kinase; 8, PEP carboxykinase; 9, malate dehydrogenase, fumarase, and fumarate reductase; 10, succinyl-CoA synthetase, αKG dehydrogenase, and αKG synthase; 11, isocitrate dehydrogenase and aconitase; 12, citrate lyase and citrate synthase. Metabolites: Glc, glucose; G6P, glucose-6-phosphate; Pyr, pyruvate; For, formate; AcCoA, acetyl-CoA; EtOH, ethanol; Ace, acetate; OAA, oxaloacetate; Suc, succinate; Cit, citrate.

