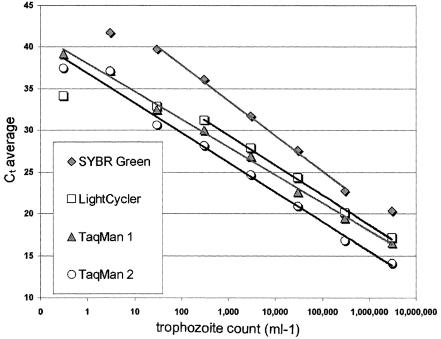
FIG. 2.
Detection limits and linearity of the real-time PCR assay. Shown are average Ct values by the four real-time PCR assays evaluated in this study, obtained with DNA extracted from stools containing 106 to 10−1 E. histolytica trophozoites per ml. The average Ct values for each concentration range were calculated and plotted against the trophozoite concentration. The linear parts of the resulting curves were determined using regression analysis and are displayed as lines.

