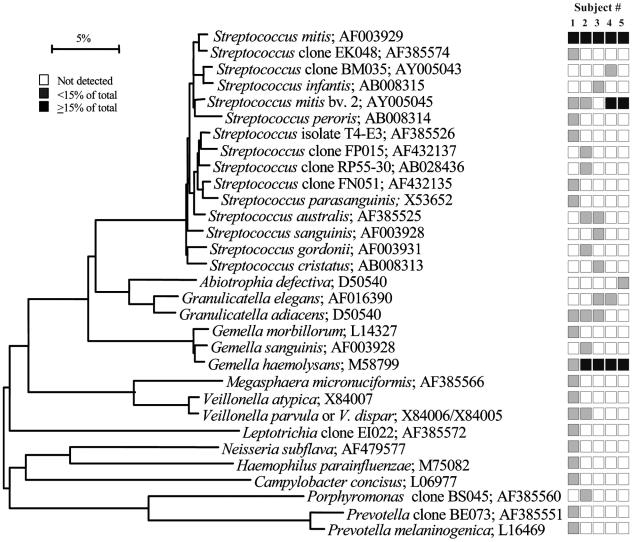
FIG. 1.
Bacterial profiles of the buccal epithelium of healthy subjects. Distribution and levels of bacterial species/phylotypes among five subjects are shown by the columns of boxes to the right of the tree as either not detected (clear box), <15% of the total number of clones assayed (shaded box), or ≥15% of the total number of clones assayed (darkened box). The 15% was chosen arbitrarily. GenBank accession numbers are provided. Marker bar represents a 5% difference in nucleotide sequences.

