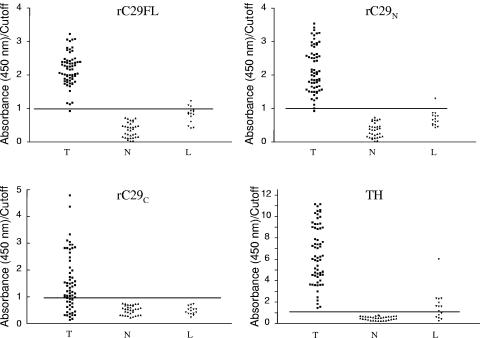
FIG. 4.
Evaluation of the reactivity of sera in the panel against rC29FL, rC29N, rC29C, and TH. The scatter plots represent the reactivity in ELISA against the different antigens evaluated with respect to the cut-off value defined as the mean OD of N sera plus 3 SD (OD/cutoff ratio) in each case. T, sera of patients infected by T. cruzi; N, sera of patients not infected either by T. cruzi or by Leishmania spp.; L, sera of patients infected by Leishmania spp. but not infected by T. cruzi.

