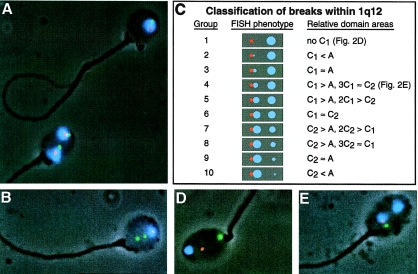
Figure 2.
Photomicrographs and classification scheme for ACM FISH methodology. A, Sperm containing two copies of chromosome 1 (bottom) can represent sperm diploidy or chromosome 1 disomy. A normal sperm is shown on top. B, Sperm carrying a terminal duplication of 1p. C, Fluorescence phenotypes and scoring criteria used to classify sperm according to the relative location of chromosomal breaks within 1q12 (see Material and Methods section and fig. 3). D, Example of a sperm carrying a chromosomal break directly between 1cen and 1q12 (i.e., group 1). E, Example of a sperm carrying a chromosomal break within 1q12 (i.e., group 4). Sperm were imaged at 1,000× under fluorescence and phase-contrast microscopy.

