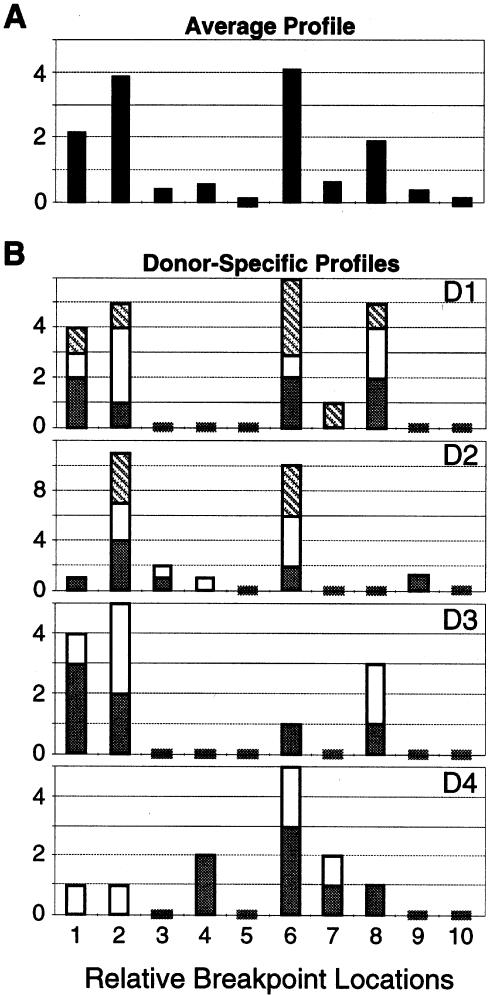
Figure 3.
Distribution of breakpoint locations within 1cen-1q12 of sperm (see fig. 2C). A, Average profile of the frequencies of sperm (per 104) in each breakpoint group across donors. B, Profiles of the raw number of sperm in each breakpoint group per donor (D1–D4). Stacked bars indicate the number of breaks observed during the first (gray), second (white), and third (hatched) coded scoring analyses for each donor. Short bars that cross the X-axis represent zero values.

