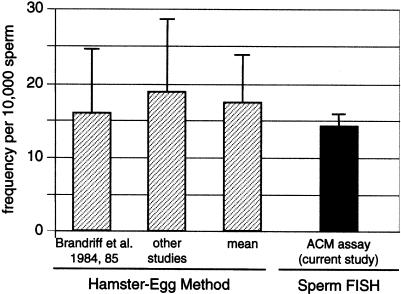
Figure 5.
Comparison of the frequencies of sperm with breaks in 1cen-1q12, as determined by FISH and hamster-egg methods. The first bar represents the mean frequency (±SE) of sperm with breaks in 1cen-1q12 in a hamster-egg study (11 total donors, 2,468 sperm [Brandriff et al. 1984, 1985]) that included the same men evaluated in the current study. The second bar shows the average of three other labs: those of Martin et al. (1987) (30 donors, 1,582 sperm), Estop et al. (1991) (7 donors, 555 sperm), and Jenderny et al. (1992) (8 donors, 450 sperm). The mean represents the weighted average of all four hamster-egg studies.

