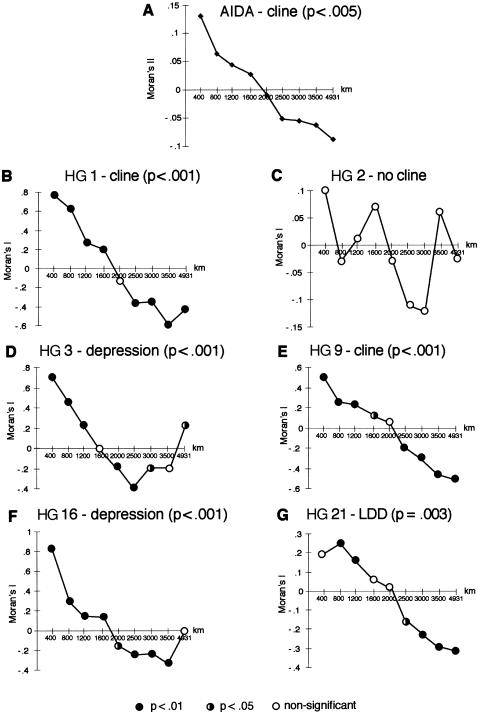
Figure 4 .
Spatial autocorrelation analyses. A, Correlogram, calculated using AIDA, for the entire data set. Overall significance is given. B–G, Correlograms, calculated using SAAP, for the six most frequent HGs. The significance of each point is indicated by its symbol, and the overall significance of each correlogram is also given. LDD = long-distance differentiation. In all correlograms, the X-axes show distance classes (km).

