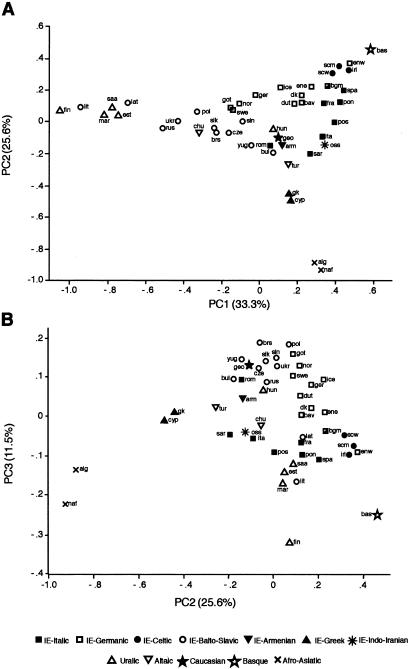
Figure 5 .
PC analysis of Y-chromosomal HG diversity. A, PC2 plotted against PC1. B, PC3 plotted against PC2. The percentage of variance explained by each component is given on the axes. Linguistic affiliation for each population is indicated symbolically; the Belgian sample is part Dutch-/part French-speaking and has a hybrid symbol. Abbreviations are as in figure 3.

