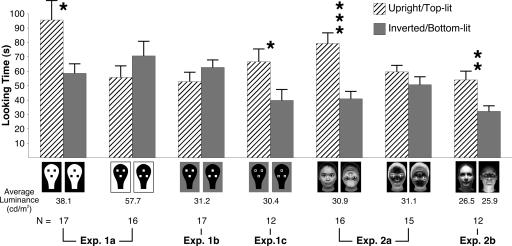
Fig. 1.
Stimuli and looking times in all experiments. Newborns' looking time to each of the pairs of stimuli was measured to reveal their preference. Significant differences are indicated by asterisks (*, P < 0.05; **, P < 0.01; ***, P < 0.001). The numbers below the columns represent the number of newborns tested in the corresponding condition.

