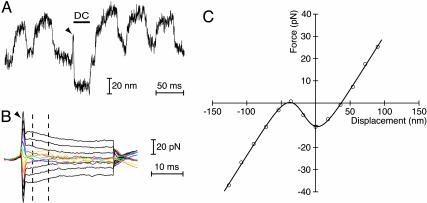
Fig. 2.
Measurement of the displacement-force relation. (A) This hair bundle oscillated spontaneously at 20 Hz with a peak-to-peak magnitude averaging 60 nm. Activated by a rapid step in the positive direction (arrowhead), the displacement-clamp (DC) system moved the hair bundle to the commanded position of -70 nm and held it there for 30 ms (horizontal bar). During this period, the force necessary to position the bundle was computed from the measured flexion of the stimulus fiber. This paradigm was then repeated for a range of displacements of both polarities. (B) The average force produced by the stimulus fiber for 13 levels of hair-bundle displacement showed three regimes. First, immediately after the displacement command, the hydrodynamic transient (arrowhead) dominated the response. During the second period, the presence of negative stiffness was signaled by the crossover of the responses for the smaller stimuli in both directions. Measurements were averaged during this period, over the interval 4-9 ms after the command (dashed lines). Finally, as adaptation concluded, the negative stiffness vanished. (C) The displacement-force curve produced from the data in B is representative of those measured just after rapid positive steps. The relation demonstrates a region of negative stiffness encompassing 40 nm. The continuous curve through the data points is a fit to Eq. 7 for the parameter values K∞ = 490 μN·m-1, n = 120, and z = 0.37 pN. The stiffness of the stimulus fiber was KSF = 273 μN·m-1.

