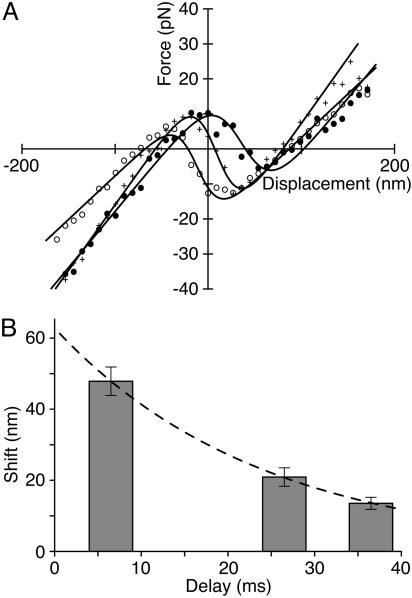
Fig. 5.
Rate of shift of the displacement-force curve. (A) For a hair bundle that oscillated spontaneously through 160 nm at 15 Hz, displacement-force curves were measured shortly after rapid positive steps (○), just after rapid negative steps (•), or with an additional delay of 20 ms after negative steps (crosses). (B) Plotting the amplitude of the shift at three intervals after large negative steps reveals an exponential course with a time constant of 24 ms (dashed line). The positions and widths of the bars represent the intervals over which the data were analyzed. The average values of the fitting parameters were K∞ = 280 μN·m-1, n = 140, and z = 0.32 pN; the stimulus fiber's stiffness was KSF = 273 μN·m-1.

