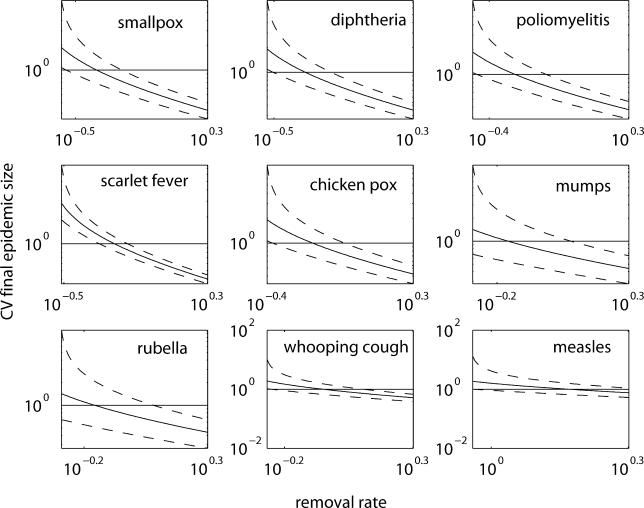
Figure 3. CV in Final Outbreak Size as a Measure of Forecast Precision for Outbreaks of Nine Directly Transmitted Diseases as a Function of Removal Rate.
The CV in final outbreak size (y-axis) is a measure of forecast precision, shown here for outbreaks of nine directly transmitted diseases as a function of removal rate (x-axis). Estimates are bounded by minimum and maximum estimates (dashed lines) of the infectious contact rate β based on estimates of R 0. The horizontal line indicates CV = 1.

