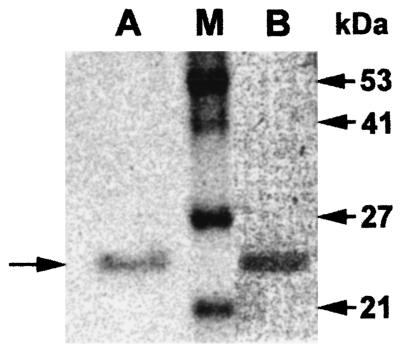
FIG. 2.
SDS-PAGE analysis of the purified β-lactamase EBR-1 from a culture of E. coli BL21(pET-EBR-1). Lane A, Coomassie blue staining. The horizontal arrow on the left side indicates the migration position of β-lactamase EBR-1. Lane M, size of relative molecular masses expressed in kilodaltons is indicated on the right. Lane B, zymogram of EBR-1.

