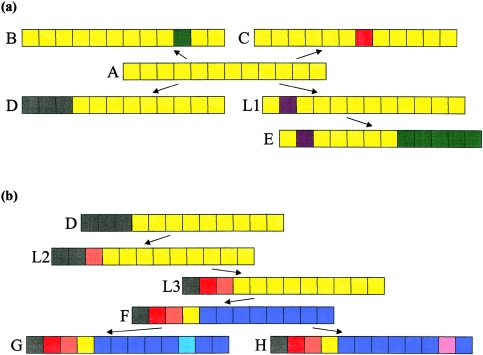
Figure 1.
Homologous portions of a chromosome. The colored blocks represent adjacent markers, and matching colors represent matching alleles. a, Illustration of how, under the assumption that the disease mutation lies in gap 4, between markers 4 and 5, observed haplotypes A–E might be arranged with A as the root. In the tree, A→D and L1→E are unambiguous recombinations, whereas the other edges could be caused by either recombination or mutation. Notice that, although haplotypes A and E are similar, they cannot be directly connected by a single edge. It appears that a haplotype is missing from the sample (or the population). Thus a latent haplotype (L1) is required for completion of the tree. The topology is approximately star shaped, with most haplotypes directly connected to the root, as would be expected from evolutionary theory for rapidly growing populations. b, Same scenario under the assumption that three more haplotypes (F–H) are observed. Of haplotypes A–E, F is most similar to D. To connect this pair, two latent haplotypes are required. Consequently, when the haplotypes are fit into a single tree, the tree is spindly rather than star shaped. If, however, two trees are fit to these data, then haplotypes A–E and F–H will split into separate clusters.

