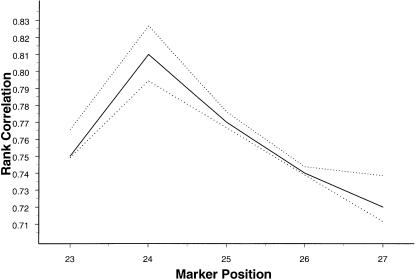
Figure 3.
Both the mean rank correlation (unbroken line), based on 1,000 replications, between squared difference of trait values of a sib pair and estimated i.b.d. scores at markers around the true QTL location, and the empirical 95% confidence band (dotted lines) for simulation parameter values α=5, β=0, σ2=1, p=.7, and ρ=.6.

