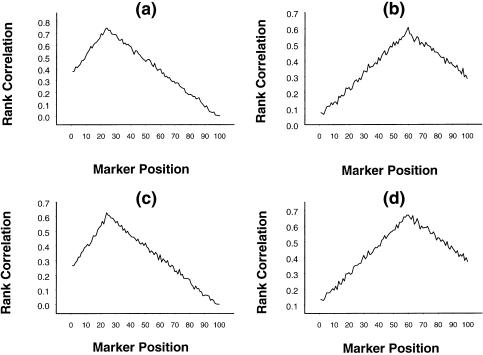
Figure 8.
Mean rank correlation, based on 1,000 replications, between squared difference of trait values of a sib pair and estimated i.b.d. scores at 100 ordered markers. Panels a and b pertain to the first and second loci, respectively, when the first locus, without dominance but with epistatic interaction with the second locus, explains 80% of the variation in trait values; panels c and d pertain to the first and second loci, respectively, when the first locus, with dominance and with epistatic interaction with the second locus, explains 60% of the variation in trait values.

