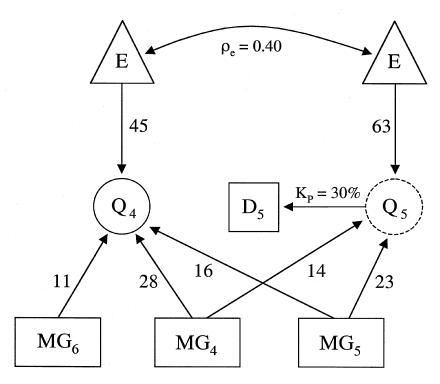
Figure 1.
Genetic model for simulated data: random environmental effect (E), major genes with additive effects (MG4, MG5, and MG6), observable quantitative trait (Q4), unobservable quantitative trait (liability) (Q5), observable discrete disease trait derived from Q5 (D5), residual environmental correlation (.40) (ρe), and population prevalence of D5 (30%) (KP). Unlabeled numbers indicate the percentage of relative additive genetic and environmental variance components for each trait. (Adapted from MacCluer et al. [1997])

