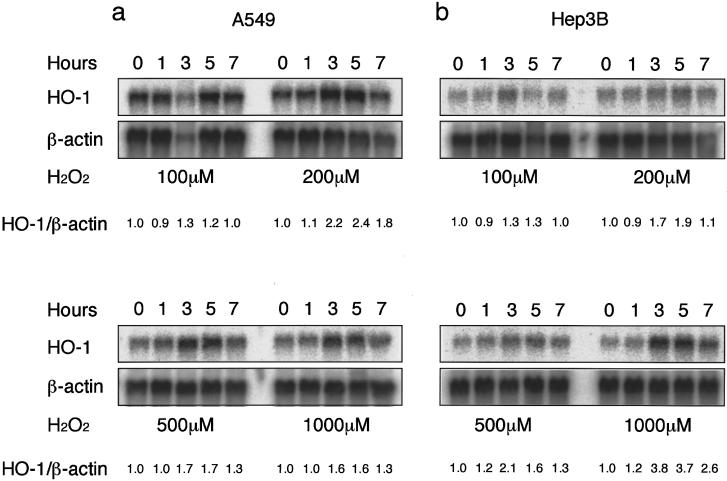
Figure 2.
Northern-blot analysis demonstrating increases in HO-1 mRNA levels in A549 cells (a) and Hep3B cells (b), before (0 h) and 1, 3, 5, and 7 h after treatment with either 100, 200, 500, or 1,000 μM of H2O2. β-Actin was used as an internal control. HO-1 mRNA was normalized with a constitutive expression of β-actin mRNA. The ratio of each normalized value to that of the 0-time control is shown as a relative expression level of HO-1 mRNA (HO-1/β-actin). Data are representative of three different experiments.

